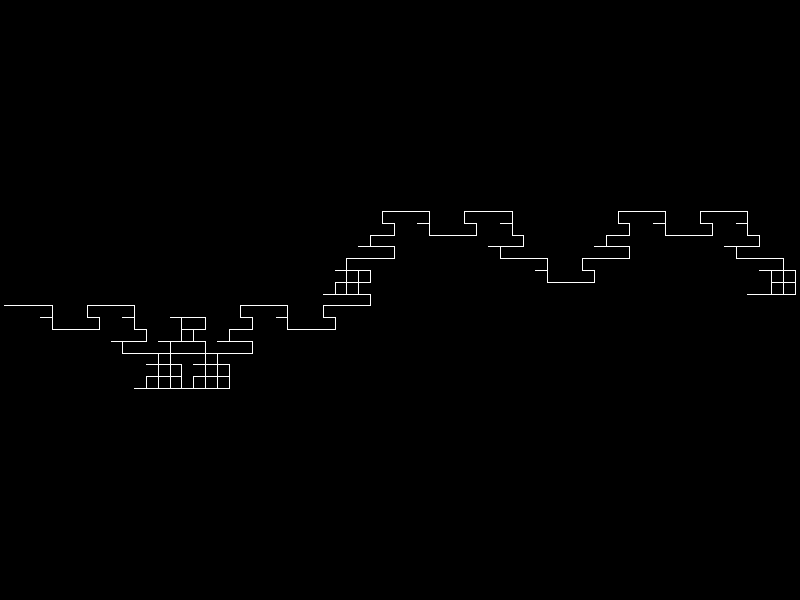
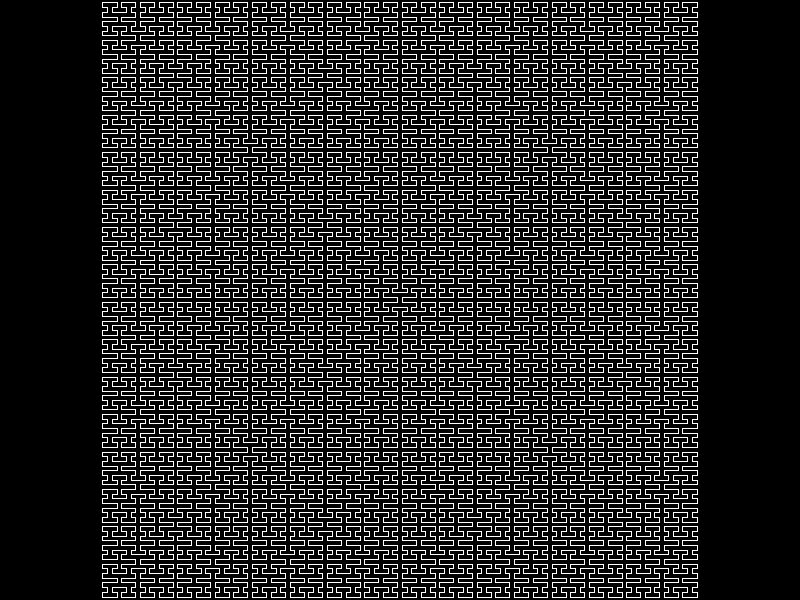
Not long ago, I went down the rabbit hole of space-filling curves, and learned about an obscure paper by Rolf Niedermeier, Klaus Reinhardt, and Peter Sanders that introduced a rather peculiar curve with an unfortunate name: H-curve [1]. The paper mentions that H-curve preserves better locality properties compared to Hilbert curve. It fills the space with H-like shapes, hence the name. Also, like the Moore curve, it generates a loop.
Space-filling curves are ridiculously easy to implement with L-system rules, and I spent a few days developing a set of axioms to express it in a rewrite system. This was a fun puzzle [2].
  A => BF-F-BFFFC-F-FC+F+BF-F-BFFFC-F-FC
  B => BFFFC-F-FC+F+B
  C => C+F+BF-F-BFFFC
hmm, i tried those rules in xfractint with 90-degree angles, and it doesn't seem to be a space-filling curve; http://canonical.org/~kragen/nothcurve.png is what i get at order 3
maybe my translation is buggy?
    hcurve {
      Angle 4
      Axiom A
      A=BF-F-BFFFD-F-FD+F+BF-F-BFFFD-F-FD
      B=BFFFD-F-FD+F+B
      D=D+F+BF-F-BFFFD  ; C is reserved in Fractint
    }
Fascinating. These rules are identical, but I don't have xfractint locally to reproduce/troubleshoot the issue. I think I was using https://dmitrykandalov.com/lsystem/ as a playground, and it appears to be fine there.
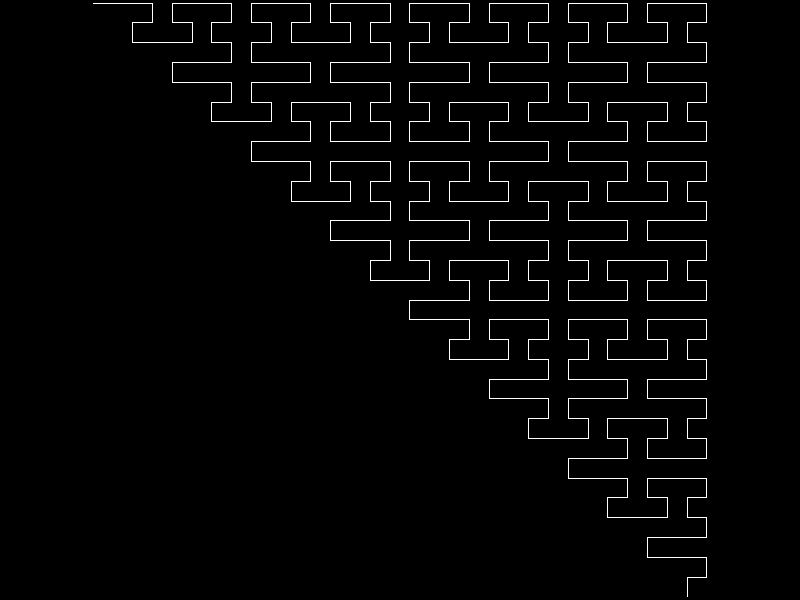
Can you try generating 1/8 or 1/4 curves to check the partial generation? Or these rules--should produce the triangular shape:
and accordingly this works on Kandalov's site with the same
axiom:
    A => AFFFB-F-FB+F+A
    B => B+F+AF-F-AFFFB
oh, now i know what the problem is, D is a drawing command in fractint; i had too much D, the opposite of the usual problem. so this works:
    hcurve { ; by oneearedrabbit.net.  See
    ; <https://news.ycombinator.com/item?id=38029945>.  Based on "an obscure
    ; paper by Rolf Niedermeier, Klaus Reinhardt, and Peter Sanders that
    ; introduced a rather peculiar curve with an unfortunate name: H-curve
    ; [1]. The paper mentions that H-curve preserves better locality
    ; properties compared to Hilbert curve. It fills the space with H-like
    ; shapes, hence the name. Also, like the Moore curve, it generates a
    ; loop."
    ; <https://www.sciencedirect.com/science/article/pii/S0166218X00003267>
      Angle 4
      Axiom A
      A=BF-F-BFFFX-F-FX+F+BF-F-BFFFX-F-FX
      B=BFFFX-F-FX+F+B
      X=X+F+BF-F-BFFFX  ; C and D are reserved in Fractint
    }
but i like `simplified` above better
incidentally the paper seems to call it 'h-indexing'
incidentally, this slight variant l-system, which is probably what you meant
  a where
  a -> afffb-f-fb+f+a
  b -> b+f+af-f-afffb
has the property that the axiom is a proper prefix of the axiom's expansion,
which turns out to be equivalent to the property
that every generation is a proper prefix of the following generation;
this means that in a sense each one is "approaching a limit"
of a single infinite string,
in the sense that it's a successively longer prefix of that string.
this infinite string,
called a 'morphic word',
is a fixed point of the mapping
the l-system does each generation
this is literally a numerical approximation if you treat the string
as a fractional number in some base, e.g., base 10 with a=1, b=2, f=3, +=4, -=5
with that interpretation, the first approximation 'a' is 0.1, the second approximation 'afffb-f-fb+f+a' is 0.13332535324341, the third approximation 'afffb-f-fb+f+afffb+f+af-f-afffb-f-fb+f+af-f-afffb+f+afffb-f-fb+f+a' is 0.133325353243413332434135351333253532434135351333243413332535324341, and so on.
the thue-morse sequence can be generated in the same way with the l-system
0 where 0 -> 01 and 1 -> 10
although the so-called fibonacci word is slightly simpler
a where a -> ab and b -> a
all of the above morphic words are aperiodic, though it's trivial to design a periodic morphic word
a program to output the infinite morphic word of movement commands for the h-curve of a single triangle is
    queue = ['a'], []
    d = dict(a='afffb-f-fb+f+a', b='b+f+af-f-afffb')
    while True:
        for item in queue[0]:
            for c in item:
                n = d.get(c, c)
                yield n
                queue[1].append(n)
        queue = queue[1][::-1], queue[0]  # amortized constant time
        queue[1].clear()
In 1990, I included the Hilbert Curve in my senior thesis for my BS in Math, which I presented to all the professors in our math department. Years later, one of those professors became a family friend. He was an incredibly supportive mentor to multiple people in our family. After he passed away last year, I learned that his great-great grandfather was David Hilbert, creator of this curve. It must have been fun to see some of his family's work displayed in one of his student's theses.
Silly me, I thought mathematicians reproduced by budding. I assumed that's what they did while reclusing in their mountain shacks between public appearances.
I love putting hilbert curves into various simulation and building games - you often get interesting results! And if you don't, it at least looks cool.
It's nice to see just how popular Hilbert curves are. For me it touches the same nerve that Conway's Game of Life does.
I threw together a hacky demo of the Hilbert curve and some other l-system curve for a middle school computer club I ran way back when. Not the best UI in the world, but it shows you either the string substitutions following each l-system ruleset, or with "show canvas" checked each click draws the next generation.
One beautiful quality of these curves is that they can nicely reduce a two (or n) dimensional space down to one, so that neighbors can be found simply by looking at ranges.
coincidentally i wrote code to render a hilbert curve in emoji the other day.
it was three or four lines of golfed python
    #!/usr/bin/python3
    T=['a'];[T.append(''.join(dict(a='lbffraffarffbl',b='rafflbffblffar').get(c,c)for c in T[-1]))for i in 'abcd'];D,V=[0],1
    for c in T[-1]:M,T=dict(f=(1,1),r=(0,1j),l=(0,-1j)).get(c,(0,1));D.append(D[-1]+M*V);V*=T
    X=range(31);print('\n'.join(''.join('⬜'[j-i*1j in D]for j in X)for i in X))
the only problem was that gpt-4 guessed wrong about which particular fractal was being drawn
i think the turtle-graphics formulation of the hilbert curve that underlies this l-system is nicer than the manhattan formulation in the linked js. i'm undecided about whether the l-system formulation as string rewrite rules is better or worse than the explicit recursion with conditionals used in the js. fractint's l-system engine includes a `!` operator which swaps left and right, which i think could make the hilbert curve simpler, though the definition in fractint.l doesn't
sudo apt install xfractint and type tlsystem and hit enter to explore more l-systems`
arguably a formulation in terms of a shape grammar or iterated function system would be a better fit
I first heard about this the other day when Clough42 (on Youtube) was talking about using the Hilbert curve setting for the bottom layer of a 3d print to make that layer look better for his final product. I haven't tried it on my own prints, but mine typically don't show the lines on the first layer, so I'm not sure it would make a difference in my prints. But maybe I'm over-extruding a bit there.
I'm not so sure. Some of what looks like an artifact on level 8 is already more clearly visible on level 7 as a density difference. Do we talk about the same thing, some white lines which are not often crossed?
The definition of the Hilbert curve is a line of width 0, so my question makes no theoretical sense.
Anyway, a real example has a line of non zero width, let's asume 1/2^n. Centered? How even is the average dendity distribution? Are the crosses real or an artifact of the pixels in my screen? I don't know and I'm curious?
Space-filling curves are ridiculously easy to implement with L-system rules, and I spent a few days developing a set of axioms to express it in a rewrite system. This was a fun puzzle [2].
[1] https://www.sciencedirect.com/science/article/pii/S0166218X0...[2] https://kruzenshtern.org/25-h-curve.html