Follow up, that same RELEASE mode .NET hello world app shows 153MB in the VMMAP tool used in the blog post, so i's not entirely because of the configuration.
I think the issue is that the tool is showing you what is mapped into the address space of the process which may not use any memory. It could be mapped files or copy on write pages etc.
When I started that post I used the DEBUG build because I (mistakenly) thought that was the only was to get the pdb symbols, but I was wrong about that.
I think that I'll update the post with RELEASE mode screenshots, because having DEBUG ones just confuses things. Very few people (no-one?) will be running a DEBUG version of the CLR in real-world situations, so it's a bit confusing to use it.
> A "simple HelloWorld program" somehow is using 76 MEGAbytes of ram? How is that sane?
This type of question was exactly why I wrote the post, I've looked at the memory usage of a few .NET apps in the past and thought exactly the same thing :-)
I hope that if people get nothing else from my post, they'll at least take a look at VMMap and see some more context for that overall value.
The CLR is quite terrible at small programs, as you're seeing.
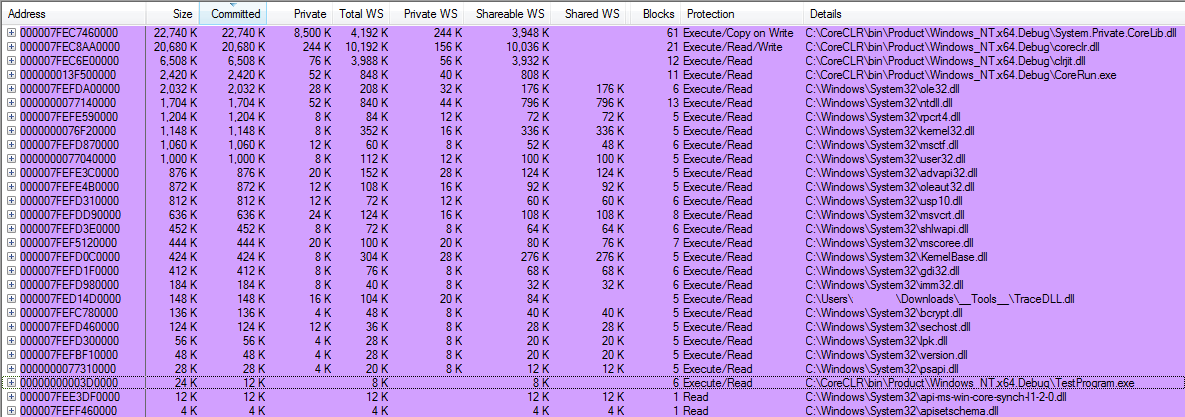
That being said, the huge "Image" section doesn't have to be as big as you're seeing. If you look at the breakdown [0], then you can see some debugging, in the form of "TraceDLL". He also mentions that the four biggest memory eaters: System.Private.CoreLib.dll, coreclr.dll, clrjit.dll and CoreRun.exe are probably bigger than normal, because he's using a debug version of the CLR.
Outside those five, every other piece of memory is shared, which changes how you see its allocation.
I'd expect it'd change a measurable amount, but as before... The CLR is best when handling bigger programs, where JITing can actually make sense.
> The CLR is quite terrible at small programs, as you're seeing.
Yeah that's a good point, I deliberately chose to do a 'Hello World' app to make it easier to see what the CLR itself was doing, so that there was the bare minimum of non-essential things going on (that would make it harder to see).
But the side-effect is that it does show the CLR in a bad-light, people expect 'Hello World' apps to be a bit 'slimmer'
The exact numbers in this post are not representive of what you see if you used `dotnet new` to create a new application:
* The debug DLLs of coreclr.dll and clrjit.dll are 4x bigger than the release DLLs.
* The debug versions allocate more at runtime.
* However in the blog post uses CoreRun.exe, which is a minimal testing harness. Dotnet.exe loads more DLLs.
On my computer I'm seeing something like 98MB commited, 8MB private, and 14MB working set. The committed number is not useful, as it a lot of DLLs get loaded in that only have a few functions in them called. The most charitable metric would be private work setting, which is 4MB.
> * The debug DLLs of coreclr.dll and clrjit.dll are 4x bigger than the release DLLs.
> * The debug versions allocate more at runtime.
Yeah, that's a good point. I'm going to update the post with RELEASE mode values, so that it's a better representation of a real app.
> On my computer I'm seeing something like 98MB commited, 8MB private, and 14MB working set. The committed number is not useful, as it a lot of DLLs get loaded in that only have a few functions in them called. The most charitable metric would be private work setting, which is 4MB.
The more I dug into this, the more I came to the conclusion that there is no one number that reflects the memory usage of an application, as you say, you almost always need to look at several values.
It's a good job VMMap exists as it makes it really easy to see the different values, I especially like that it detects the GC Heap as a separate category.
Indeed, for many years I worked quite comfortably on a 486 with 36MB (4+32) of RAM, running far more than Hello World programs...
76MB may seem like a relatively tiny amount now (it's <1% of a typical PC's RAM today), but in absolute terms that is still seventy-six million bytes. One should naturally wonder why that much memory is required to display a simple string of text.
> One should naturally wonder why that much memory is required to display a simple string of text.
Its not but by and large when people open a .NET project they want to do more than just print text, hence the inclusion of many .NET assemblies that enable the programmer to perform a variety of tasks.
If your only task is to print text then yes, its the wrong tool for the job.
Very true, for many years I worked comfortably on a Apple ][ with 64K of RAM. Nostalgia aside, I don't really want to go back to those days. However, I think it's good for programmers of today to work on a small embedded system without OS to see how much you can do with a tiny fraction of the resources a modern PC gives you.
A "simple HelloWorld program" somehow is using 76 MEGAbytes of ram? How is that sane?